Intro to Data Wrangling with Python and Pandas
General ·I had the opportunity to teach a few data science courses over the summer, and part of my interview was to see if I could teach a topic in 15 minutes.
This is only the first part of the lecture. The second part has a notebook with code samples, which you can find on github.
What is data wrangling?

In North America, a wrangler is someone who is employed to handle animals professionally, especially horses. They would round up and take care of the cattle for ranchers and cowboys to use.
Data wrangling is the process of accessing and transforming data so that the result can be easily summarized for analysis and other purposes. This process is typically carried out by data engineers, who prepare data for the data scientists to analyze.
Data can come in various forms and can be accessed in several different ways, but the process of cleaning and transforming data stays more or less the same.
Why is it an important skill?
80% of the data analysis process is spent cleaning and preparing data
Data sources used in academics tend to be pre-processed and much cleaner than data used in the industry, so this is a very important skill to develop when you start working in the field.
Data preparation is not just a first step, but must be repeated many times over the course of analysis as new problems come to light or new data is collected.

What is clean data?
Happy families are all alike; every unhappy family is unhappy in its own way
- Leo Tolstoy
There is no easy to follow set of rules when it comes to cleaning data because it usually depends on what you intend to do with the data. However, there are some general guidelines we can learn from:
- Data should be stored in a structured format, with labeled rows and columns
- Each row in the dataset represents and observation (a person, an object, an event)
- Each column describes a characteristic of the observation (a person’s height or name)
- Each type of observation is stored in a separate table (don’t mix people with objects)
For more details on what clean data really means, check out the paper on Tidy Data in references section below.
Common operations
Based on the characteristics of clean data above, we can identify some common operations we need to perform on data to clean it up:
- Read the data into a structured form
- Investigate the data to find potential problems
- Clean the data to fix the issues identified:
- Group or split rows and columns
- Fill in or remove missing values
- Remove outliers or unusual observations where appropriate
- Make clean data available for analysis or other purposes
What is Pandas?

Pandas is the most widely used data analysis library created for Python, and it has many built-in functions that will help with data analysis, including cleaning data.
As with all libraries, it’s important to get some practice using them and to make sure to read the documentation. See the references section for a link to the official Pandas documentation, as well as some links to practice courses.
Data structures
Pandas is short for panel-data, which refers to the nature of the way data is stored in Pandas.
Pandas allows us to store our data in different data structures represented by Python objects, and to perform operations on these objects. The most common data structures include:
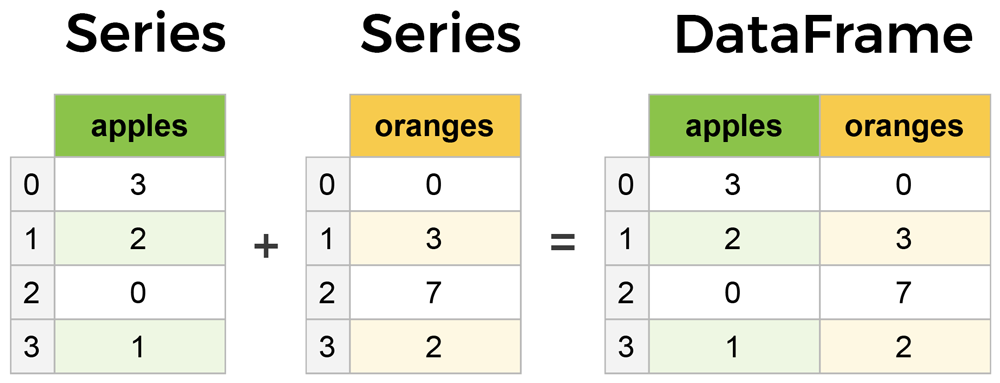
- Series: A one-dimensional array of data with labels.
- DataFrame: A two-dimensional array of data with labelled rows and columns.
Common functions
Given the common operations required to clean data above, we can use the following functions on our data structure to help with each step of the cleaning process:
| Operation | Function |
|---|---|
| Read the data into a structured form | read_csv(), read_sql() |
| Investigate potential problems | head(), info(), shape, describe(), unique(), value_counts(), isnull() |
| Clean the data | fillna(), dropna(), stack(), unstack(), groupby() explode() |
| Make clean data available | to_csv(), to_sql() |
For examples of how to use these functions, stay tuned for the second part of this series.
For a complete list of all functions, see Pandas documentation in the references section below.
Missing data
It’s very common that you will get a dataset where values for certain observations are missing. A large number of missing values could affect the analysis, so they will have to either be removed or filled in with an estimate.
There are many ways of estimating missing values that cannot be covered in the scope of this lesson. Please take a look at the reference section below if you are interested in learning more.
Other considerations
Depending on the nature of your project, you may have new data coming in on a regular basis. You will most likely have to clean all the new data as it comes in, so it’s a good idea to turn your cleanup operations into a script that can be easily run on new data.
References
Tidy Data - Hadley Wickham, Journal of Statistical Software