Dashboarding in Tableau
General ·Another year, another semester. This time I’m enrolled in a class that involves using Tableau to build a set of dashboards using data from the Toronto Open Data Portal. Ultimately, I settled on data related to building permits and real estate development applications since the real estate market is such a hot topic these days.
Unfortunately, since Tableau is licenced software, I can’t easily share the dashboard with someone who does not have a licence. For those who have a licence, you can download the dashboard from github and take a look for yourself. For those who don’t, I’ve included some screenshots below along with an explanation of the dashboard features. Also, for what it’s worth, I tried to draw some conclusions from the data.
Assessing the Impact of COVID-19 on the Toronto Real Estate Market
Table of Contents
Executive summary
Toronto’s real estate market continues to be a popular topic of conversation as many try to understand the impact of the on-going COVID-19 pandemic. This report will try to help city residents and officials alike understand the pandemic’s impact on the city’s real estate market through the lens of development applications and building permits.
Development applications and building permits are required in order to renovate or redevelop land and buildings within the boundaries of the City of Toronto. The number of applications submitted and permits requested can be interpreted as an indicator of real estate investment activity by property owners, which can have several important implications for existing residents and city officials. As far as residents are concerned, the value of properties in the surrounding area may increase or decrease as a result of development activity or lack thereof. City officials, on the other hand, may want to keep an eye on the number of residents requiring city services as new residential units are developed or existing units expanded.
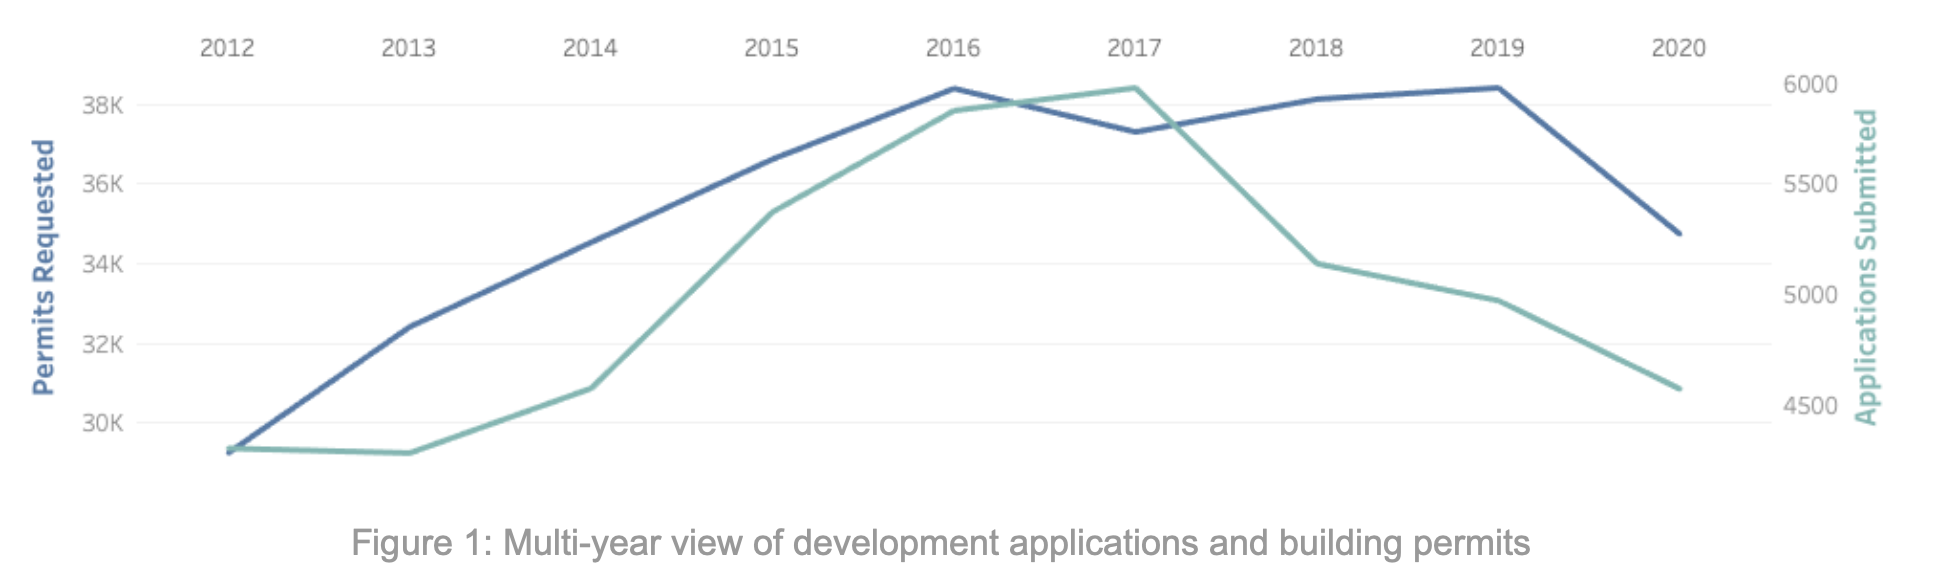
While the data varies by neighbourhood, overall, the analysis shows a declining trend in the amount of development applications requested since before the beginning of the pandemic, while the amount of building permits saw a sharp decline starting in 2020 (Figure 1). This suggests that the pandemic did not have a big impact on development applications, rather that the decline is part of a trend established before the pandemic started. However, when it comes to building permits, the data does suggest the pandemic is having an impact that may be of interest to the audience.
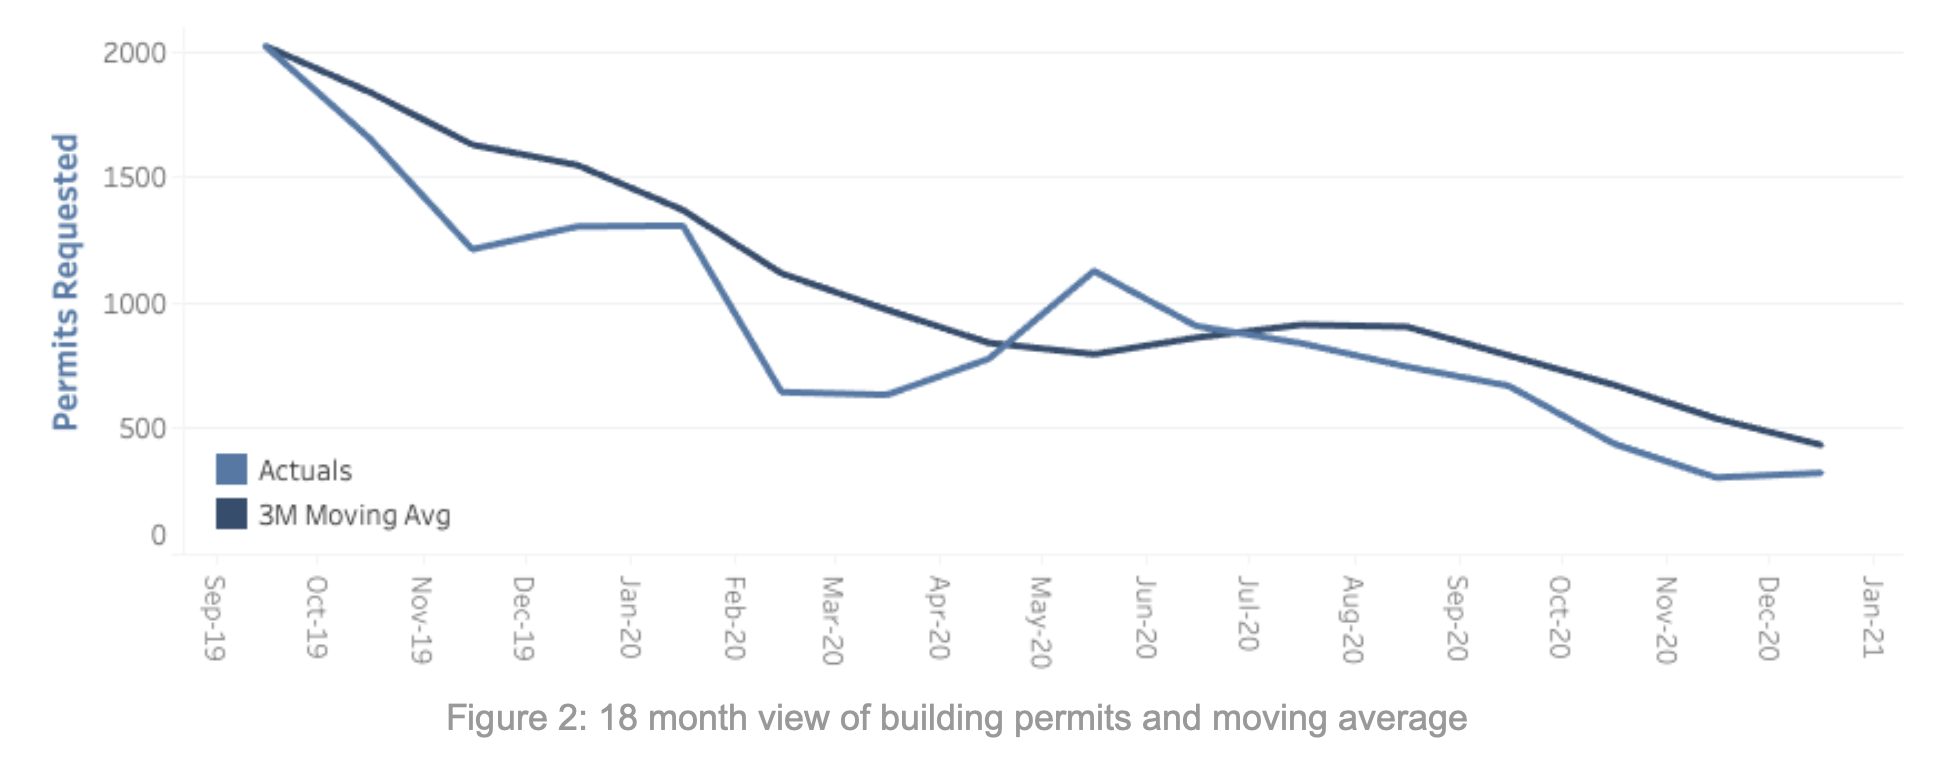
When taking a closer look at recent data on building permits, there appears to be a sharp decline that coincides with the start of the pandemic in Q1 2020 (Figure 2). The 3-month moving average continues to show a downward trend without showing any signs of recovery, which indicates that the pandemic may be having a lasting impact on building permits. Further insight can be gained by filtering on the type of structure the building permit is applied to, which shows that the trend is mostly made up of residential properties.
Overall, although the declining trend in building permits in the wake of the pandemic may seem alarming, it is only one of many indicators that can be used to assess the overall health of the real estate market. There may be other indicators that are telling a different story. Also, it’s important to note that there are some neighbourhoods that show trends different than that of the city as a whole. In order to facilitate this analysis, two dashboards were prepared in Tableau using the data from the Toronto Open Data Portal. The remainder of this report will explain the dashboards to potential users as well as highlight a few key insights derived from the data.
Dashboards
Two dashboards were built in order to help assess the COVID-19 impact on building permits and development applications.
Dashboard 1 - Overall Trends
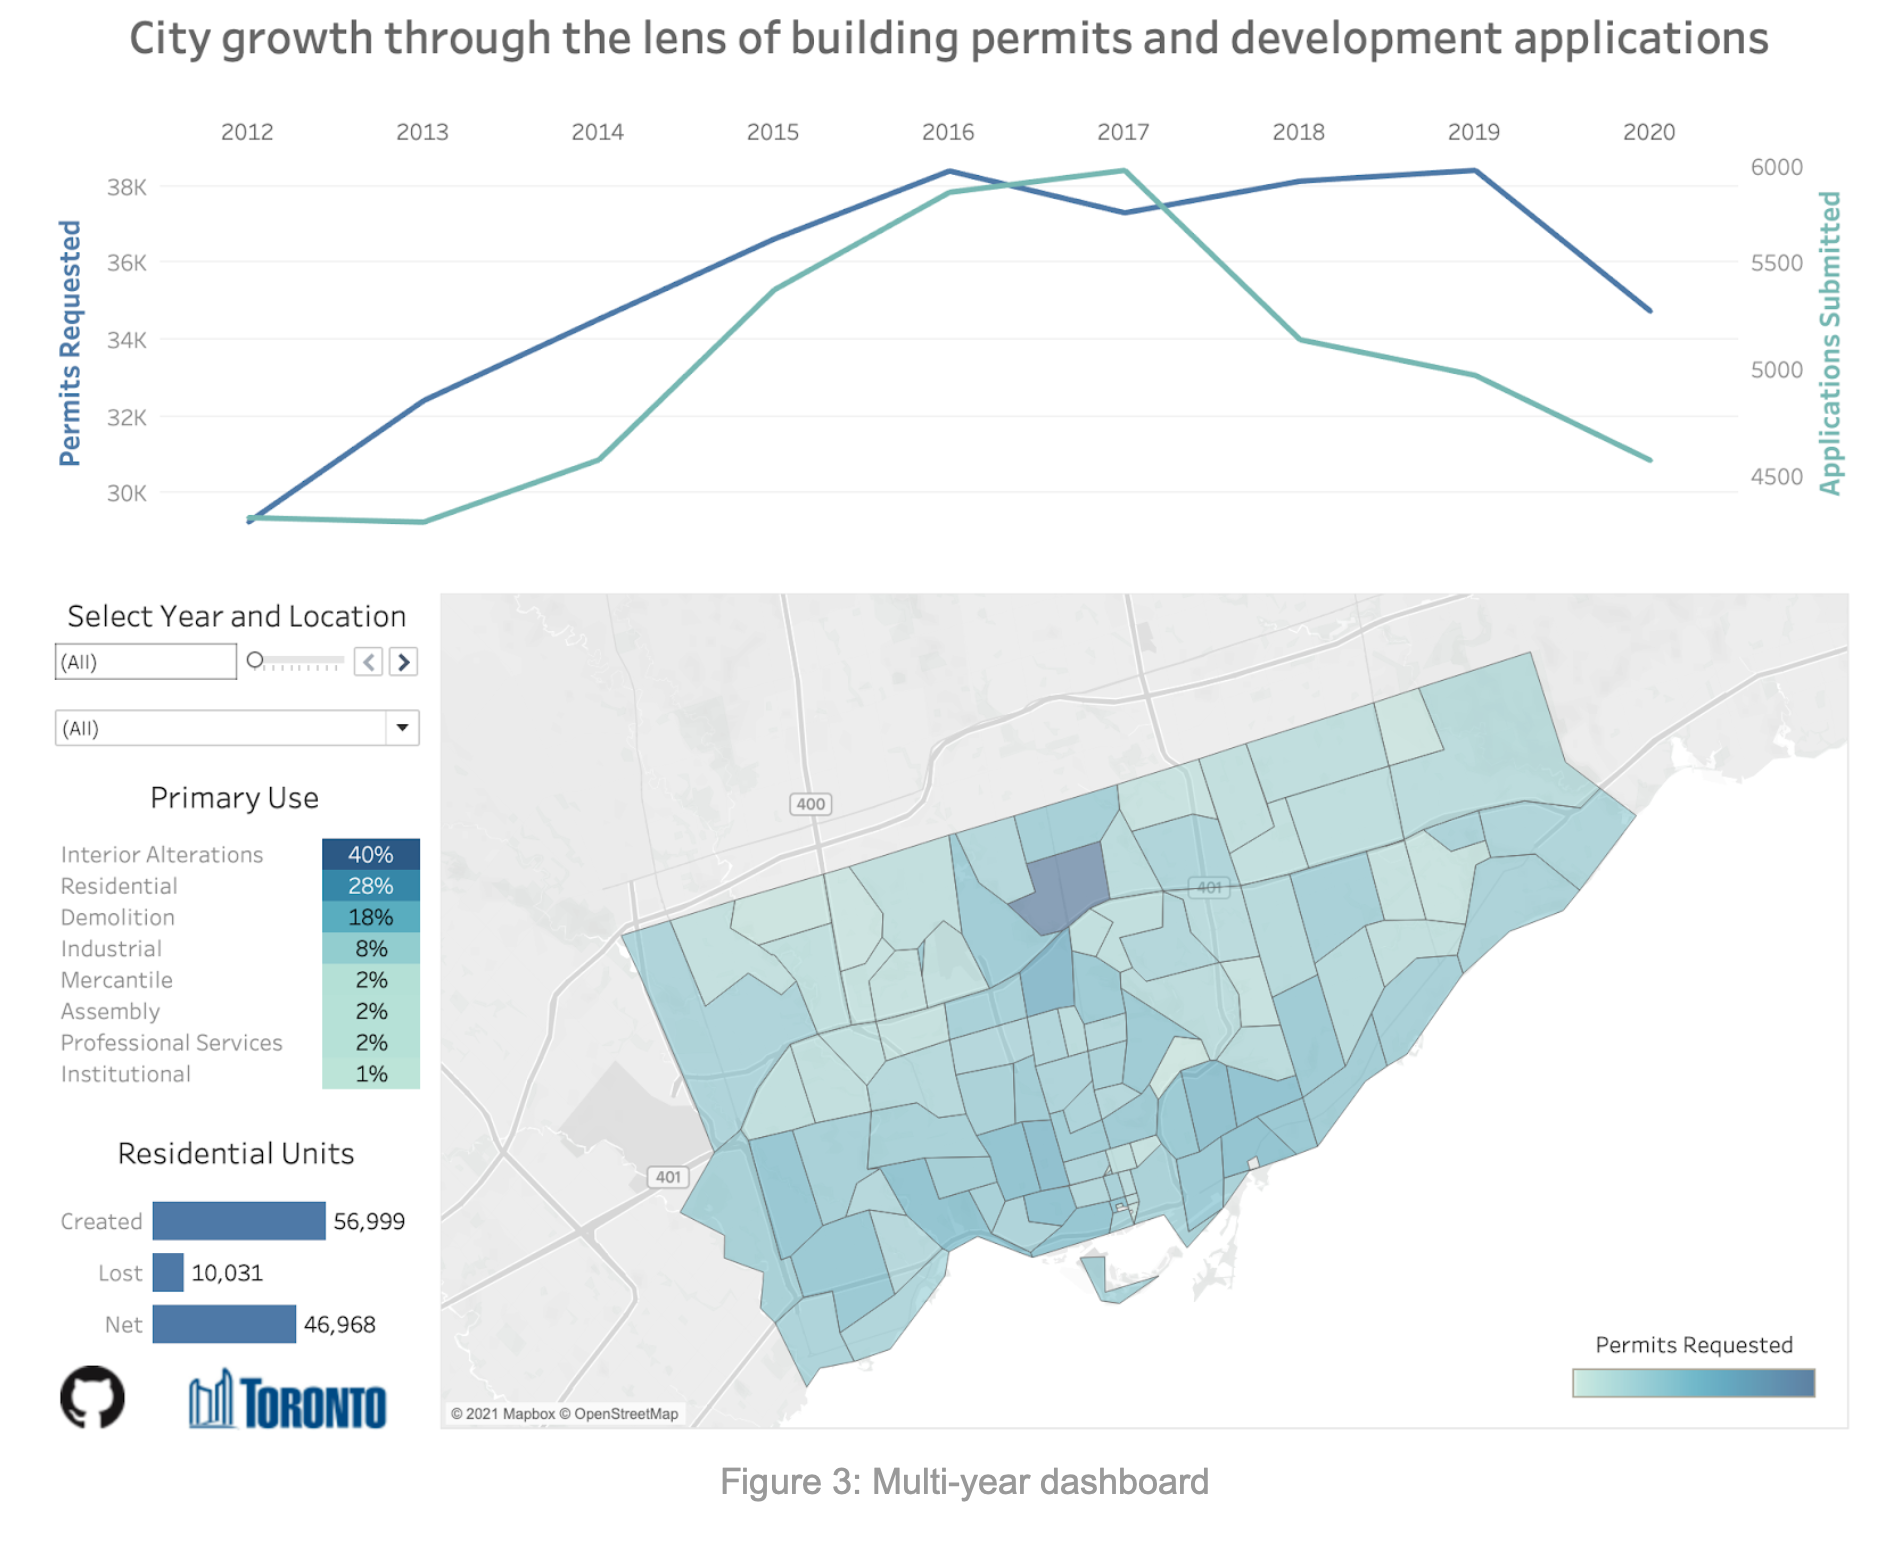
A multi-year dashboard was constructed to show the overall trend in the number of building permits and development applications being processed (Figure 3). The information is broken down by neighbourhood and shows the primary use of building permits as well as the number of residential units created, lost, and the overall gain or loss in units. Users can move through time and see how each neighbourhood was doing before COVID-19 broke out during early 2020.
Users can filter the information by selecting one or more individual neighbourhoods in the map, or by selecting a particular year or borough from their respective slider and drop-down menus. A tooltip also appears with additional information as well as a link that allows users to look up the neighbourhood’s profile on the City of Toronto website.
Dashboard 2 - COVID-19 Impact
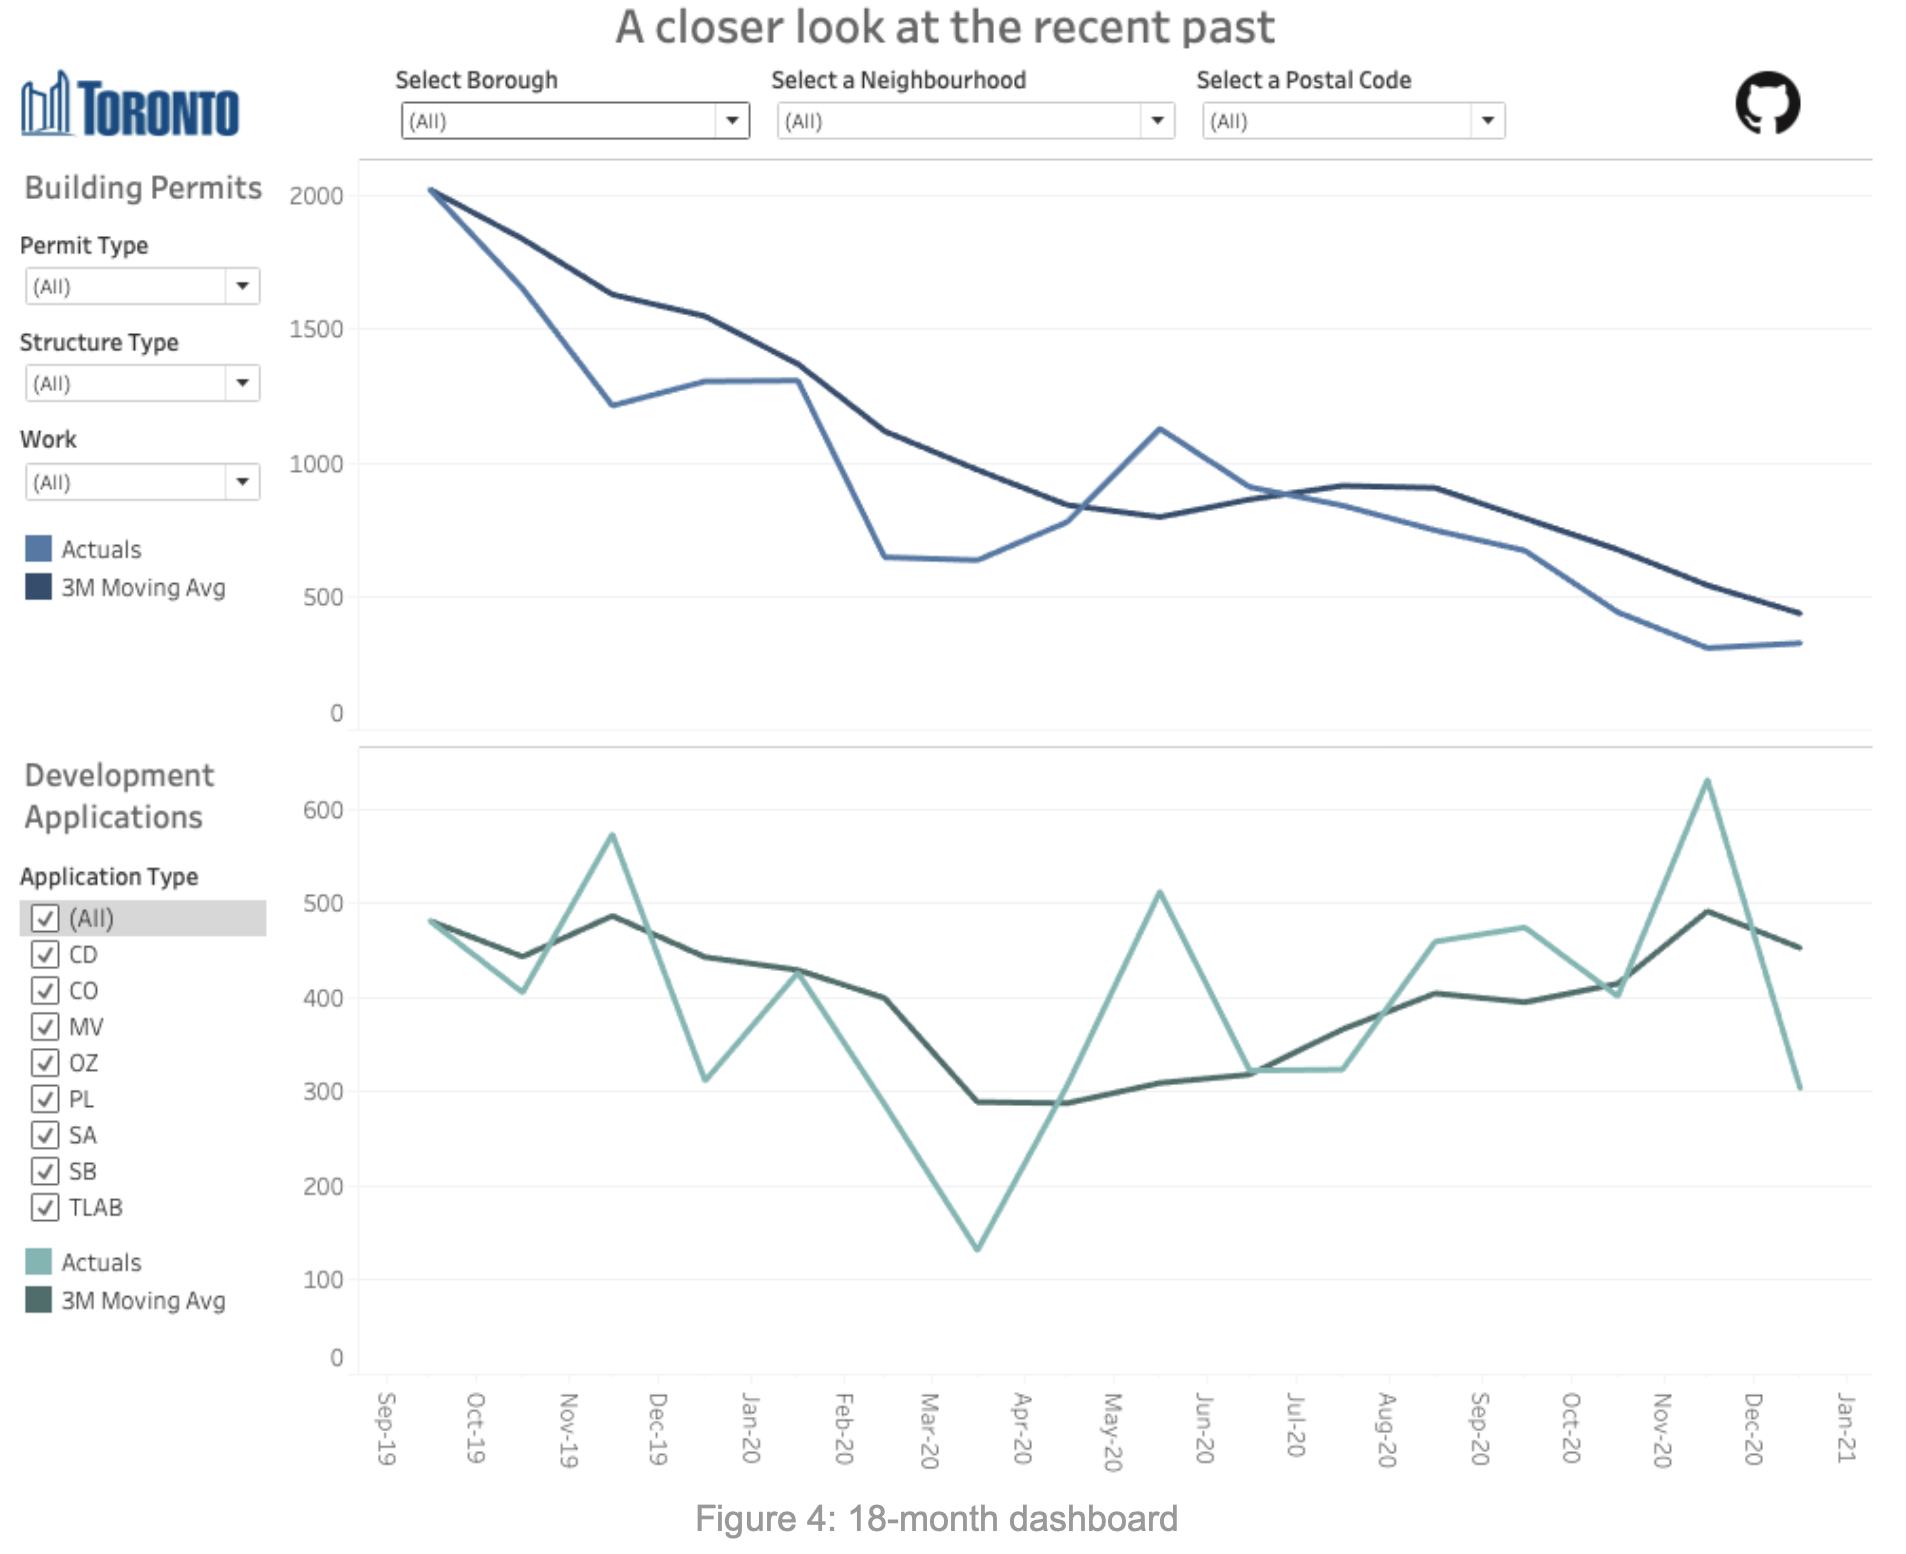
The second dashboard shows the more recent data along with year-over-year comparisons to allow users to more closely assess the impact of COVID-19. To assist users with their analysis and capture trends, a three month moving average was added in addition to the actual data to smooth out the impact of month-over-month volatility. Common filters as well as filters specific to both building permits and development applications were added to allow users to drill down on the data as necessary.
Data sources
Multiple datasets were gathered from the Toronto Open Data Catalogue to support the analysis. Some of the data includes acronyms that are defined on the City of Toronto’s website. Please follow the links below for definitions for each data source.
- Development Applications
- Building Permits - Cleared Permits Prior Years
- Building Permits - Cleared Permits Current Year
In addition to this, some data was also gathered from Wikipedia to add context, specifically, the names of neighbourhoods and boroughs that correspond to postal codes found in the data.
Data pre-processing
Data was pre-processed in Python to facilitate dashboarding in Tableau:
- Building permits data was scattered across different files for each year, so it was combined into one file and the date assigned based on the file name.
- The resulting dataset was quite large, so it was aggregated by year and postal code to support the multi-year dashboard.
- Dates had different formats across different files, so some work was done to make them consistent before adding the data to Tableau.
- The first three letters of the postal code were used to tie together the data from the various files, which is then combined with the neighbourhood names from Wikipedia.
- Please see the code in this repository for more details.
Key insights
In addition to the overall trends identified in the executive summary, the dashboards allow users to investigate trends at the neighbourhood level. Although trends in many areas align with those of the city overall, there are some boroughs and neighbourhoods that stand out from the rest. City officials and residents alike may want to investigate the data accordingly to understand the impact on particular neighbourhoods.
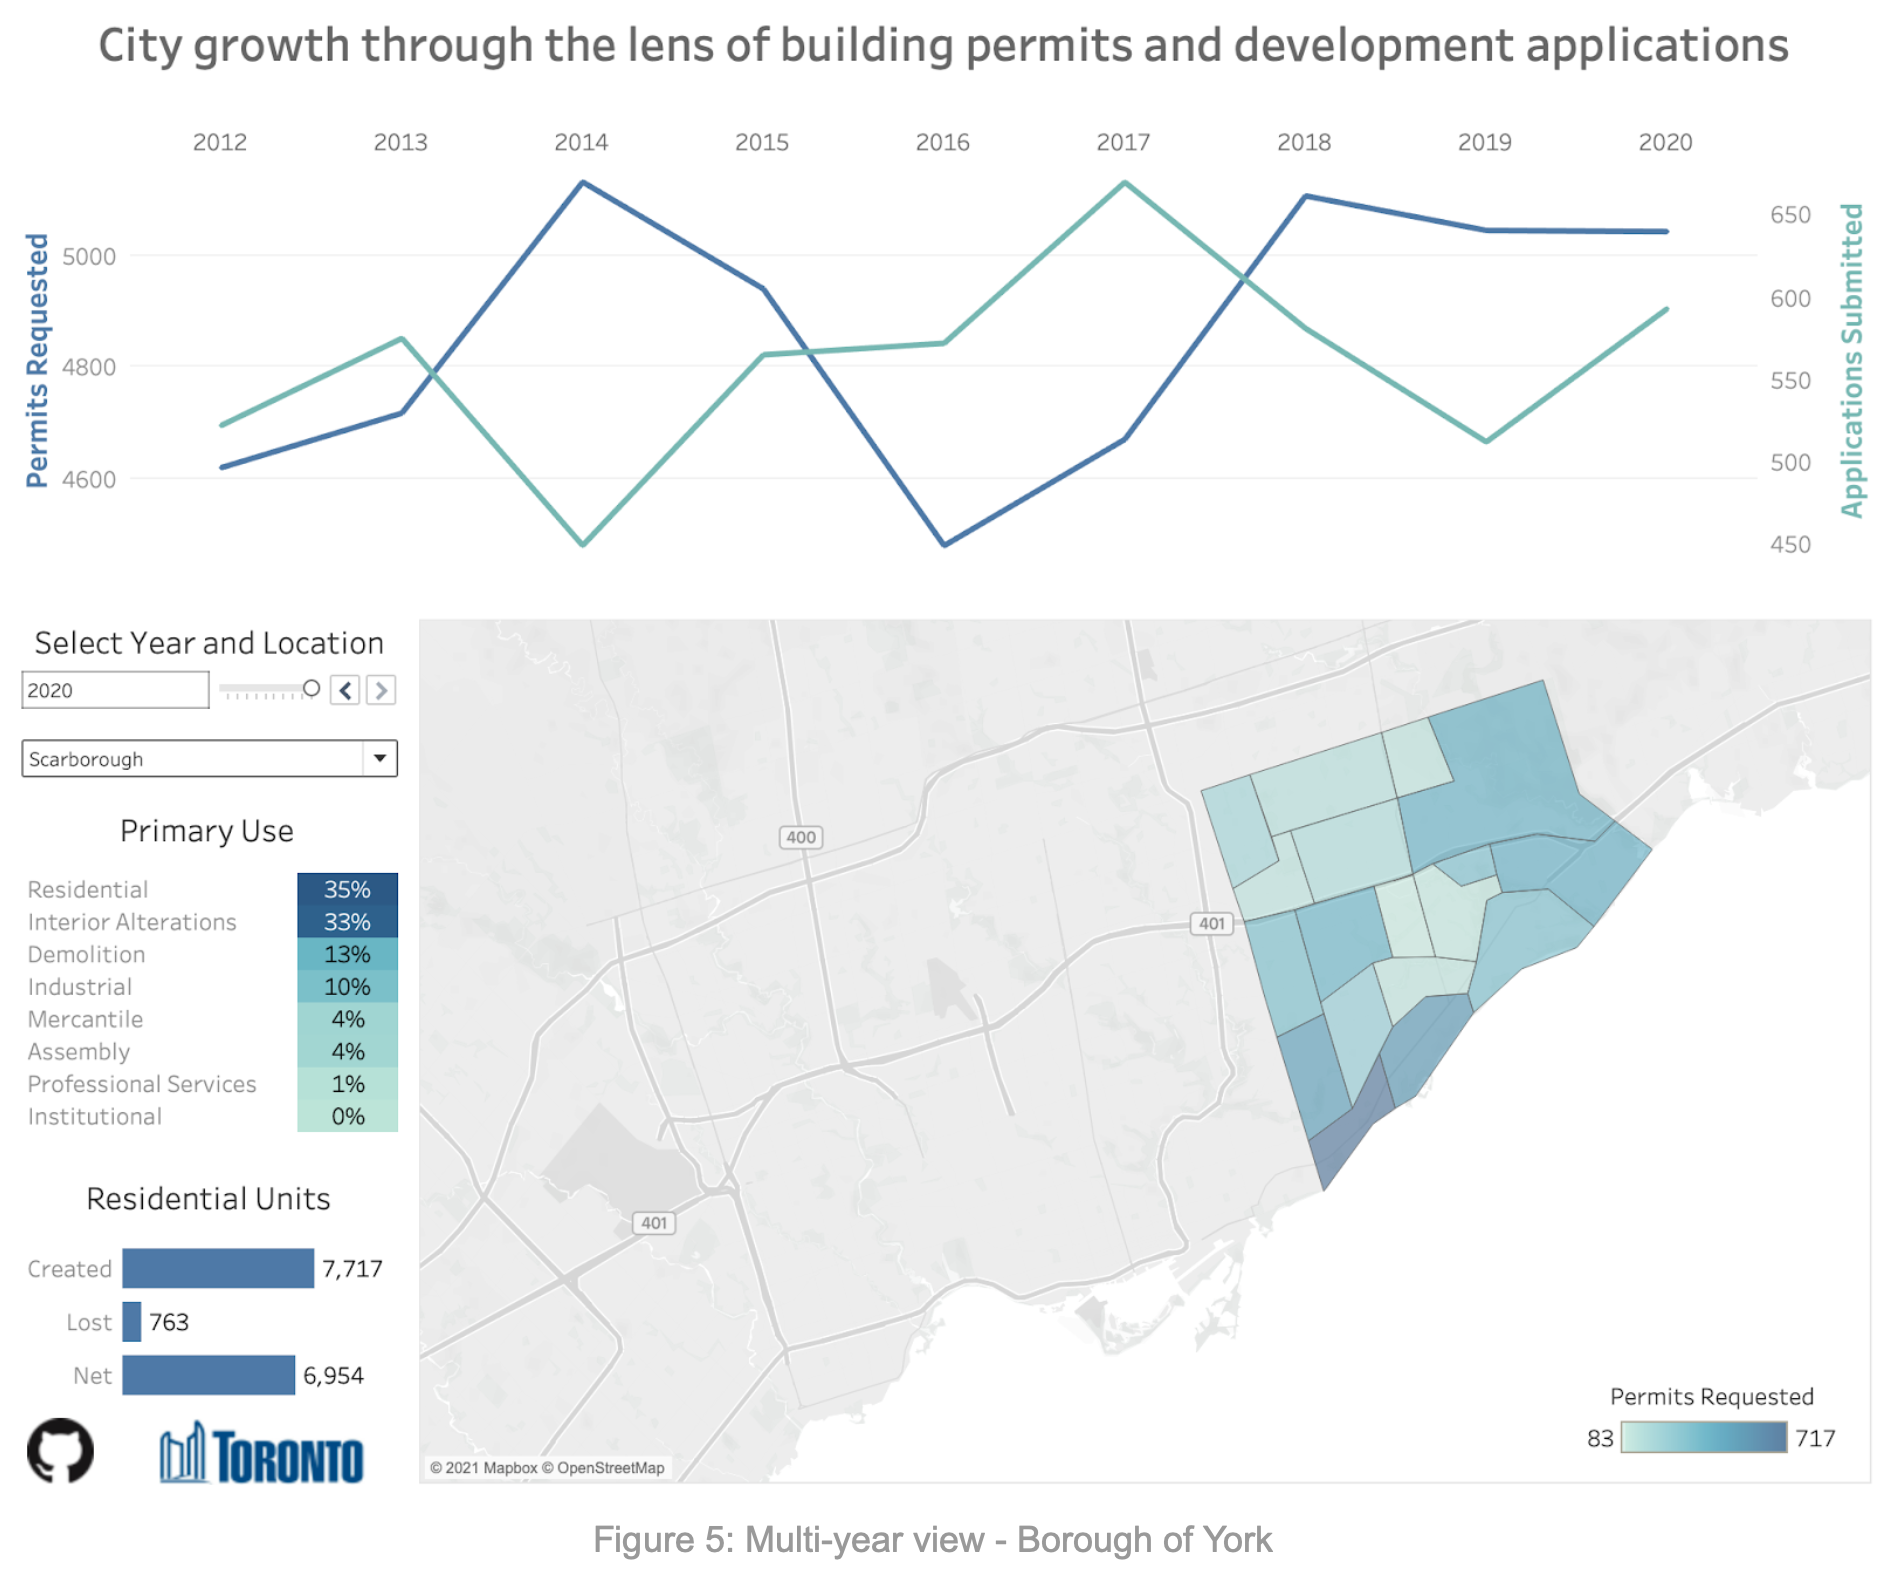
Scarborough
The borough of Scarborough is located in the Northeastern portion of the city and includes a total of 17 neighbourhoods. Despite the pandemic, the area has seen a relatively steady number of building permits since 2018 as well as an year-over-year increase in the number of development applications, which contradicts the overall city-wide trend (Figure 5). Most building permits were used for interior alterations and residential purposes, as many home-owners are most likely looking to renovate the space they are spending most of their time.
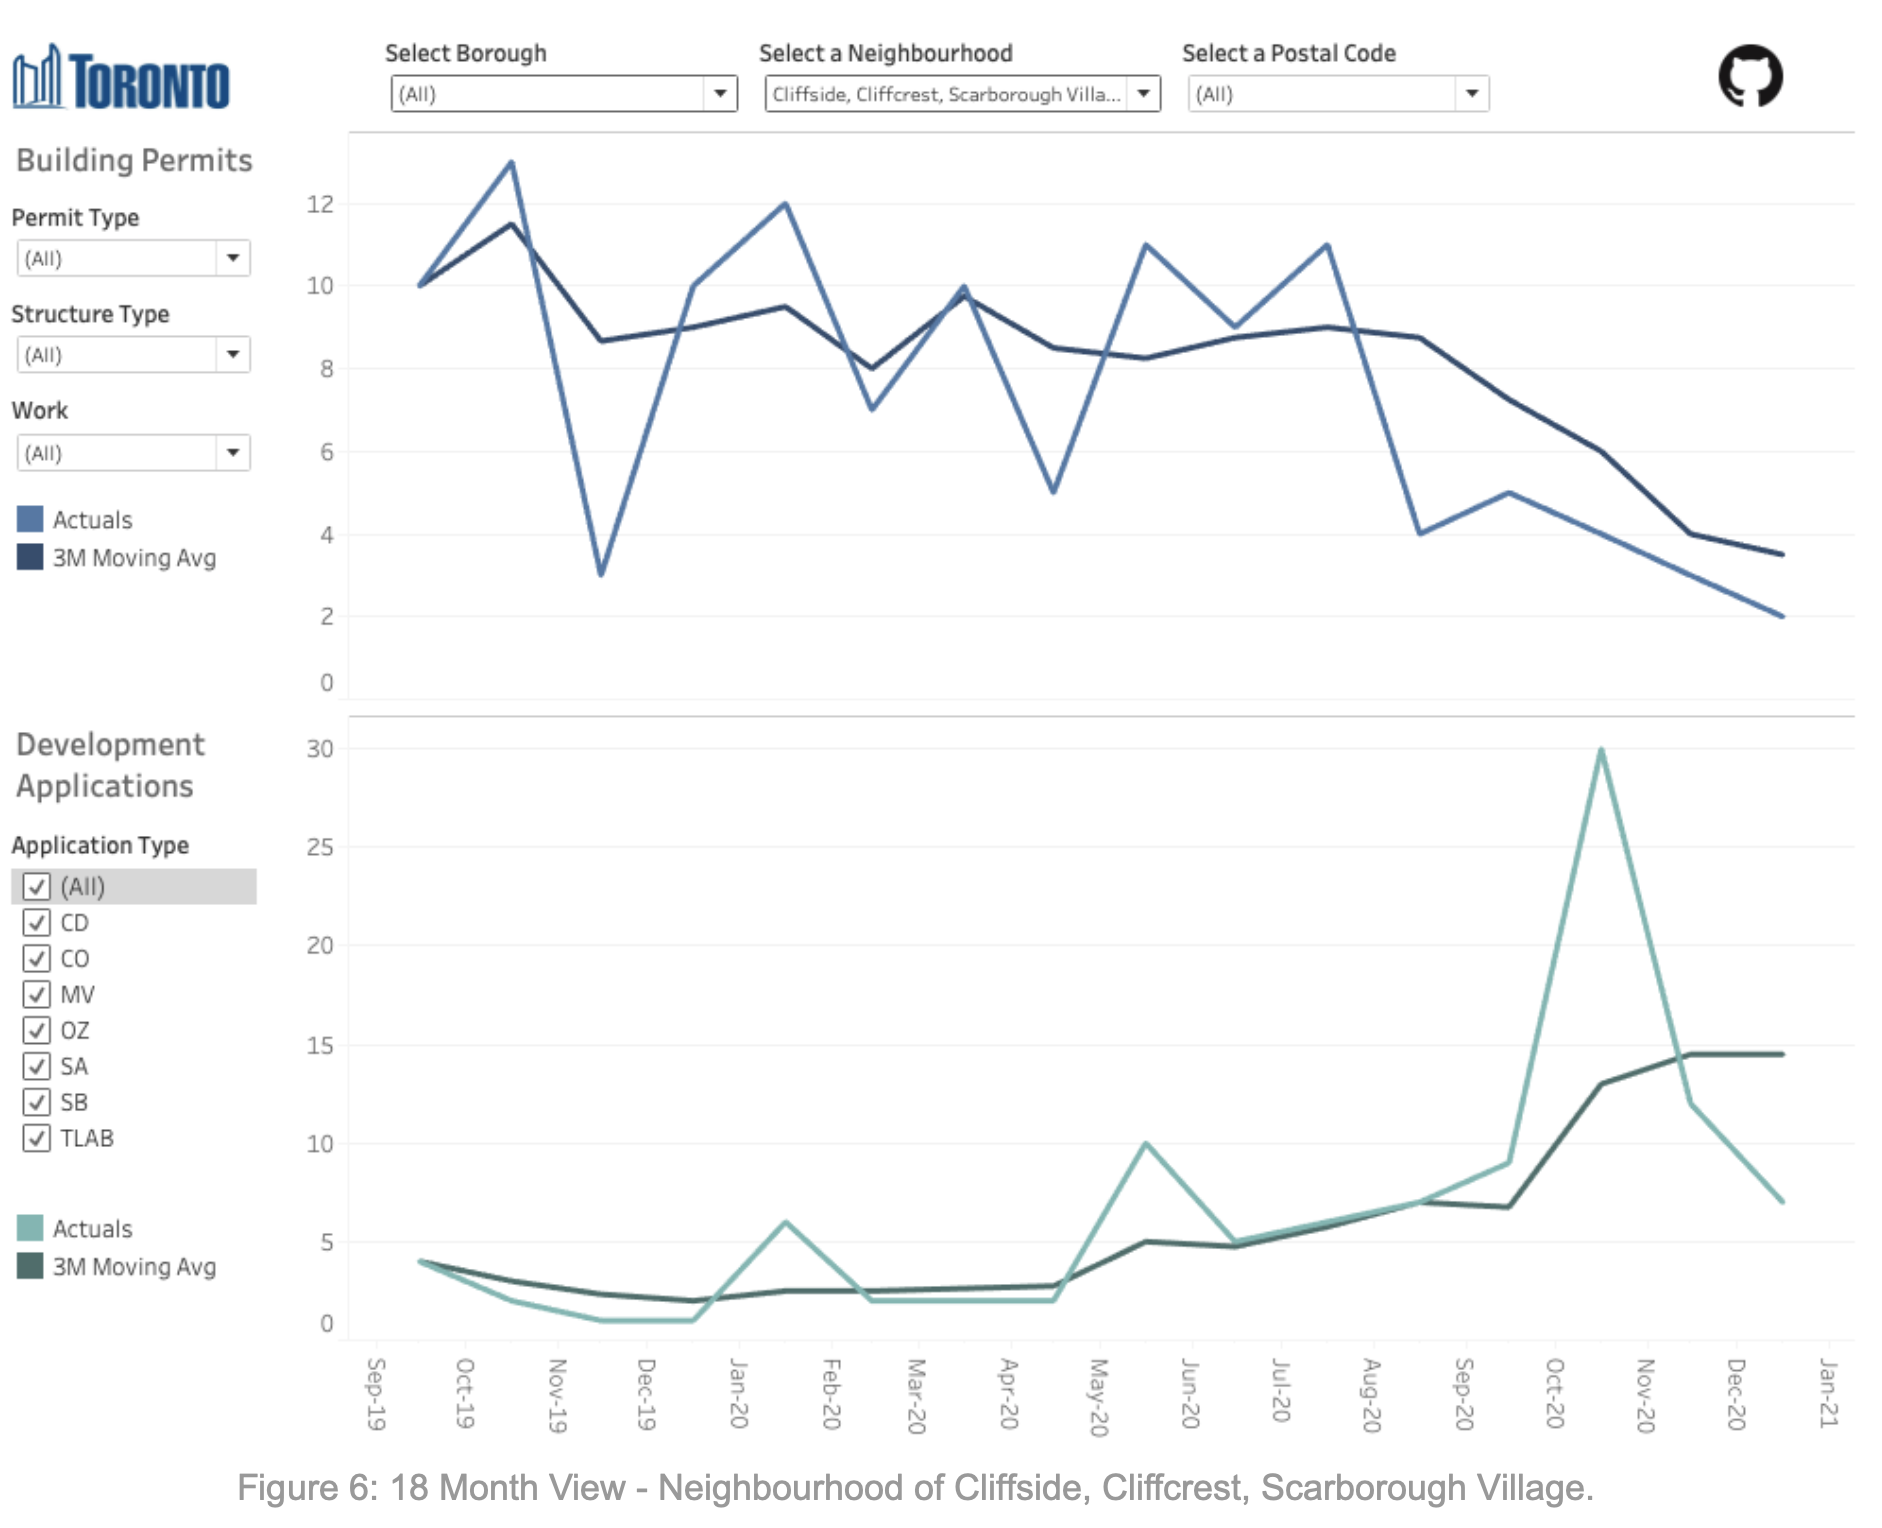
Cliffside, Cliffcrest, Scarborough Village
One neighbourhood that stands out in the borough of Scarborough is Cliffside, Cliffcrest, Scarborough Village. While building permits held steady throughout most of the pandemic, the number of development applications is trending upwards, particularly in late 2020. The intuition that this activity is related to residential projects can be verified by closer inspection of permit and application types: Many of the building permits were requested for small residential projects and the development proposals were mainly for minor variances.
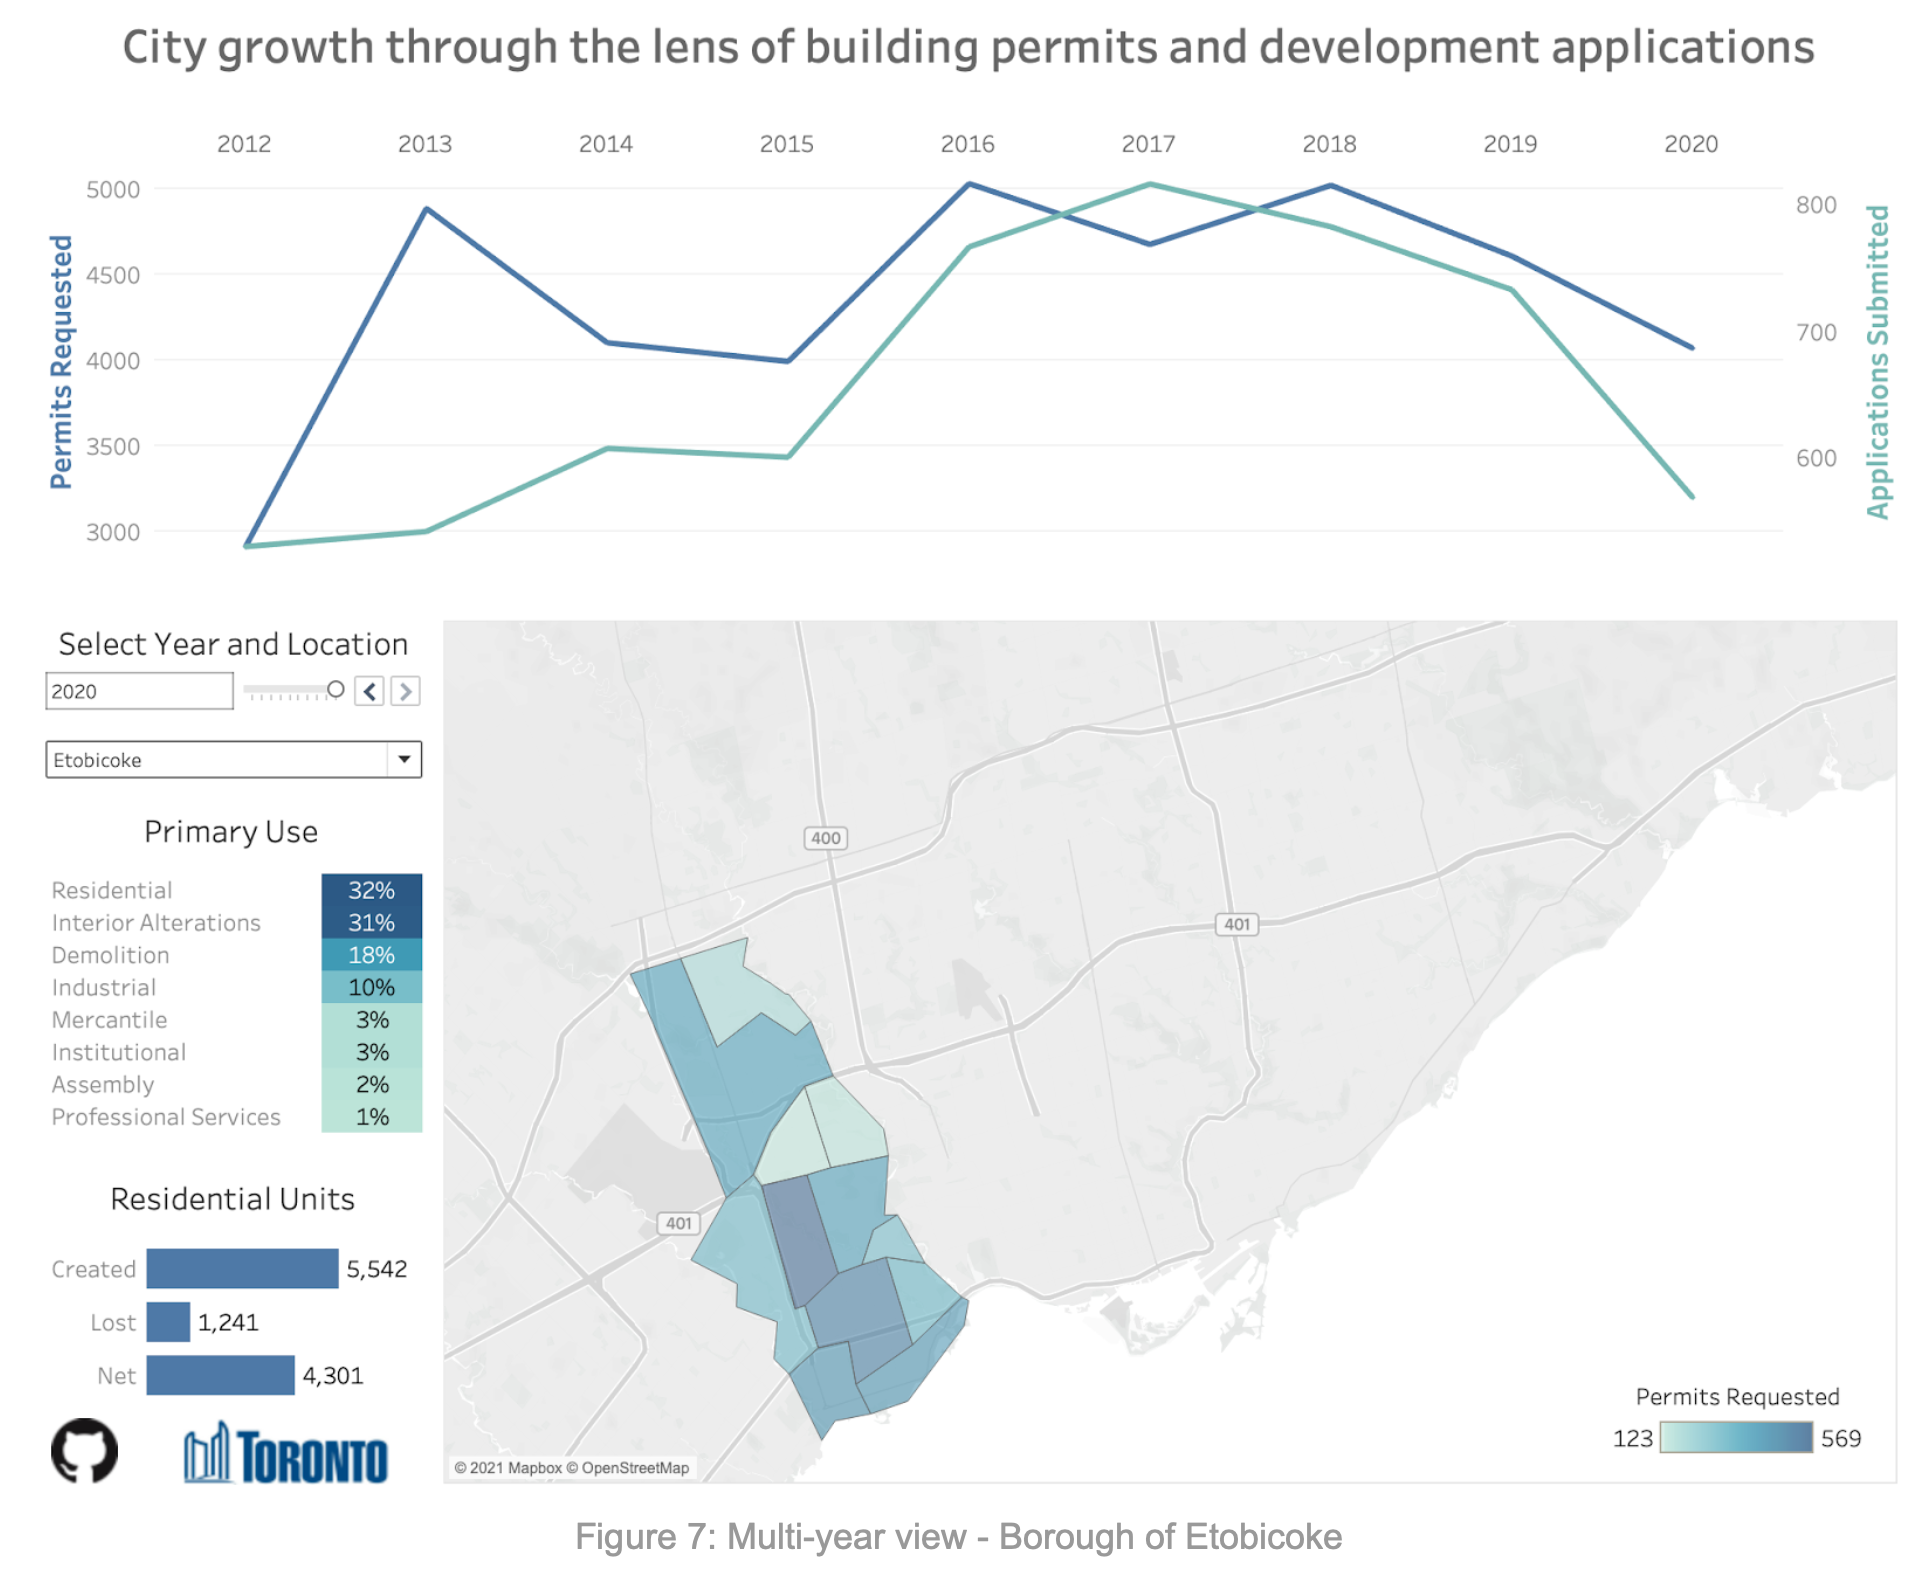
Etobicoke
The borough of Etobicoke is located in the Western part of the city and contains 12 neighbourhoods. Etobicoke has seen a decline in both the number of building permits and development applications starting in 2019 and the trend accelerates in 2020 (Figure 7). Although this trend pre-dates the pandemic, it’s still prudent to assess the impact COVID-19 has had on the trend by looking at more recent data. Also, considering there are 12 neighbourhoods included, it is also helpful to drill down further.
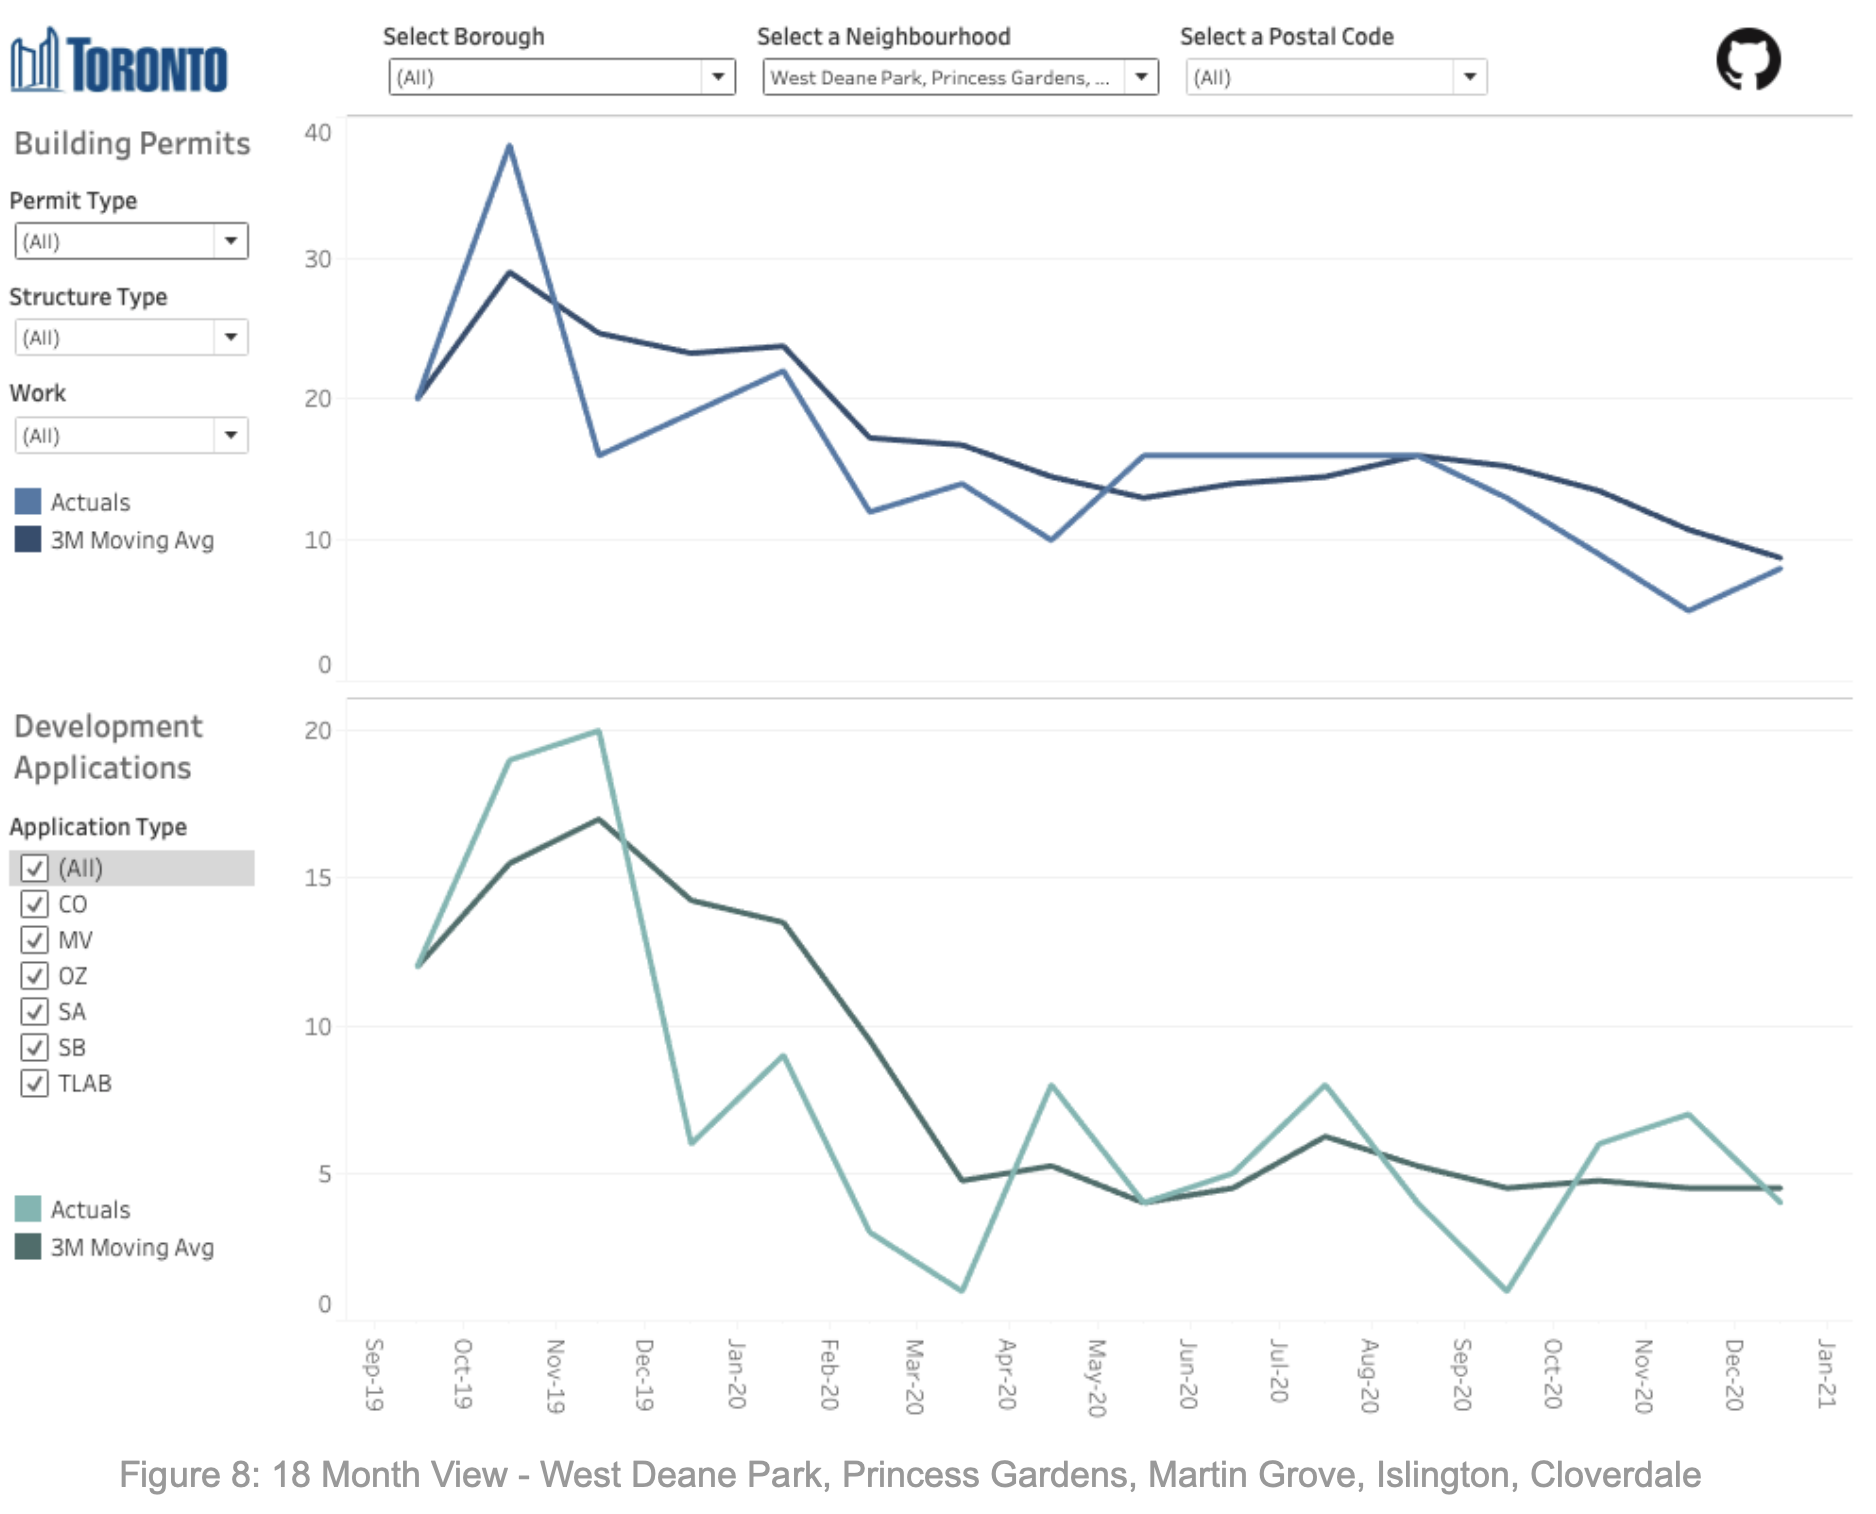
West Deane Park, Princess Gardens, Martin Grove, Islington, Cloverdale
One of the neighbourhoods in Etobicoke that is showing a decline in both building permits and development applications is West Deane Park, Princess Gardens, Martin Grove, Islington, Cloverdale. Despite a seasonal uptick during the summer months, it appears that the neighbourhood has yet to experience a recovery in applications and permits (Figure 8). Looking at the type of structures involved, it appears to be mainly driven by detached residential homes.
Conclusion
At the end of the day, there are many different indicators one can use to assess the overall health of the real estate market in Toronto. While the number of building permits and development applications processed by the city is an interesting piece of data, it cannot paint the whole picture.
That being said, the data does reveal some interesting trends, and the data is detailed enough to allow analysts to drill down in meaningful ways. Also, because the data was collected using the postal code, it was easy to combine with other datasets to gain additional insight. Ultimately, there are many ways to filter the data that may uncover insights, and this report attempts to highlight only a few. For example, while areas such as Scarborough appear resilient to the impact of the pandemic, others like Etobicoke are showing signs of weakness.
Once vaccinations are more prevalent, and everyday life can begin to return to some sense of normalcy, it will be interesting to keep an eye on the data for signs of a recovery.